Analytics & Visualization
Business Intelligence
SAP, Excel, and Tableau — transforming raw data into actionable insights.

Data Story
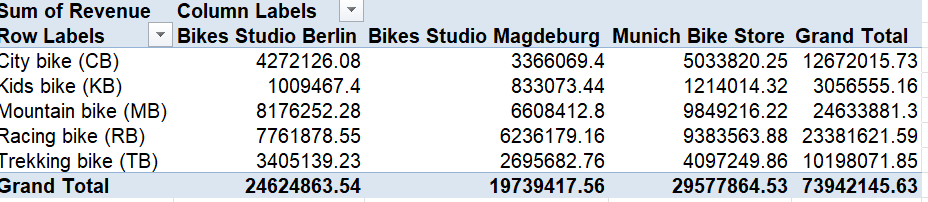
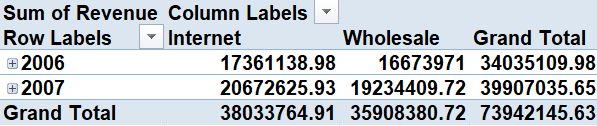
The business question driving this analysis was: which product categories and regions are generating the highest profit margins, and where should a company prioritize resources for growth? Using SAP as the source of transactional data, we extracted sales figures, costs, and regional breakdowns. That data was cleaned and structured in Excel, where we built pivot tables and calculated margin percentages by category and geography. We then visualized the findings in Tableau, creating a dashboard that allowed stakeholders to filter by region, product line, and time period to see trends at a glance. The most significant insight was that two product categories were generating 70% of total margin while consuming only 30% of marketing resources — a classic misallocation that the raw data made invisible until visualized. The dashboard transformed what would have been a quarterly report into an interactive decision-making tool.
Tool Identification
SAP
Source of transactional data — sales, costs, inventory records pulled directly from the ERP system.
Microsoft Excel
Data cleaning, pivot tables, and margin calculations. Structured the raw SAP export into analysis-ready format.
Tableau
Interactive dashboard creation. Visualized regional and category performance for stakeholder presentation.
Reflection
The 'So What?' — Why does this analysis matter? What business decision does it support?
The "so what" of this analysis is resource reallocation. Once the dashboard revealed that two categories were generating the majority of margin while being underinvested in, the business case for shifting marketing budget became data-driven and defensible rather than anecdotal. Without this analysis, leadership might continue investing proportionally across all categories out of habit or fairness, leaving significant profit on the table. This type of BI work directly supports decisions about where to grow, where to cut, and how to tell the story of performance in a way that non-financial stakeholders can actually act on. For me as a future financial analyst, the ability to move from raw ERP data to a visual executive summary is one of the most valuable technical skills I can develop before entering the workforce.